Research Services
Brand Tracking
Understanding your brand’s health
We’ve developed a framework that provides a holistic read of brand health, taking into account each of the brand health ‘pillars’ that impact your brand’s long-term value and health. We measure all the ways your brand can grow, including experience, commitment, momentum, and motivation.

Custom Brand Power
KPIs and perceptions
Momentum
Metrics for Analysis
- Awareness, Familiarity
- Perceptions: Heard positive things about the brand, Modern, etc.
Informs Strategic Areas
- Campaign Strategy (expand reach, tighter audience targeting, differentiation)
Motivation
Metrics for Analysis
- Consideration, Likelihood to Buy
- Perceptions: Interesting, etc.
Informs Strategic Areas
- Communications Strategy (more relevant and impactful messaging)
- Pricing Strategy (price structure, price points, stratification)
Experience
Metrics for Analysis
- Satisfaction
- Perceptions: Good value, High-quality service, Convenient, etc.
Informs Strategic Areas
- Operational Excellence (improved service aspects, innovation efforts)
Commitment
Metrics for Analysis
- Frequency, Share of Wallet, Loyalty, Likelihood to Recommend (NPS)
- Perceptions: Brand Trust, Worth Paying For, etc.
Informs Strategic Areas
- Loyalty and Referral Programs (social media and influencers, customer rewards)
Advanced Analytics
that elevate your data
With decades of tracking experience under our belts, we have a wide variety of analytic approaches at our disposal, including:
Key Drivers Analysis
Regression analysis can help surface the critical factors in a category that either drive or inhibit the choice of providers.
Quadrant Analysis/S.W.O.T.
Can be used to identify how you perform on the most critical drivers.
Gap Analysis
Can be used to identify how your performance compares to key competitors.
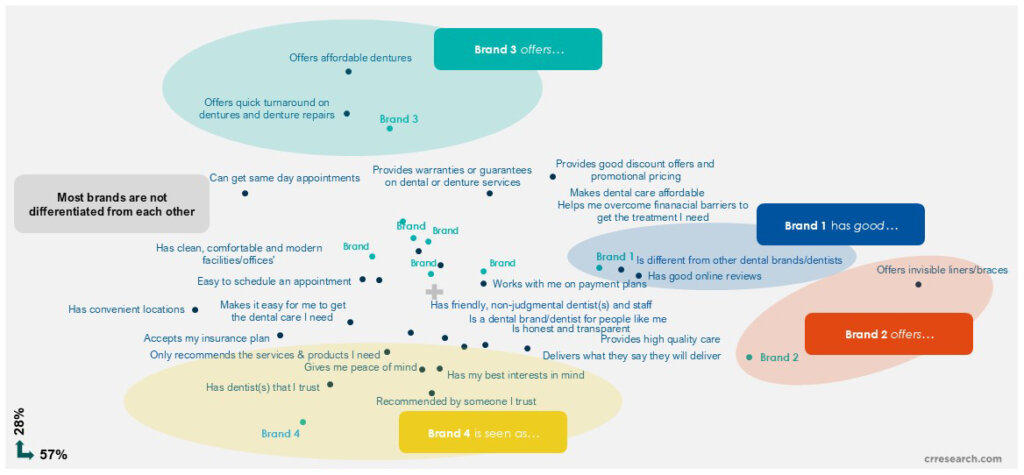
Perceptual Mapping
Will help visualize the perceptual attributes that different providers “own” in consumers’ minds relative to other providers, helping identify where you are most differentiated.
Perceptual Mapping Example

S.W.O.T. Analysis
A S.W.O.T Analysis is another powerful tool that C+R utilizes to provide you with a greater understanding of how your brand presence aligns with consumer priorities.
Weaknesses
Dimensions plotted in the upper left- hand quadrant are of above-average importance, but below-average performance. These are the weaknesses; areas driving brand choice, but where the brand isn’t performing as well.
Low Performance
Threats
Dimensions plotted in the lower left- hand quadrant of below-average importance and below-average performance. These are threats. Even though they don’t drive choice now, if importance were to grow, these would become brand weaknesses relative to other attributes.
High Importance
Low Importance
Strengths
Dimensions plotted in the upper right- hand quadrant are of above-average importance and above-average performance. These are brand strengths relative to other attributes.
High Performance
Opportunities
Dimensions plotted in the lower right-hand quadrant are of below-average importance and above-average performance. These are areas of opportunity to build importance.
Learn the Issues that Plague Brand Health Trackers
Brand Power Model Elevates Data via Sophisticated Modeling
Our “Brand Power Model” provides a trackable composite metric based on a sophisticated analytics that identify brand strength vs competition.
- Trackable over time
- Simplifies key metrics to a single KPI
- Makes it easier to diagnose drivers of KPI trends
- Customizable
- Derived from analytics to be relevant to each unique industry
Example of how scores would be compared across brands

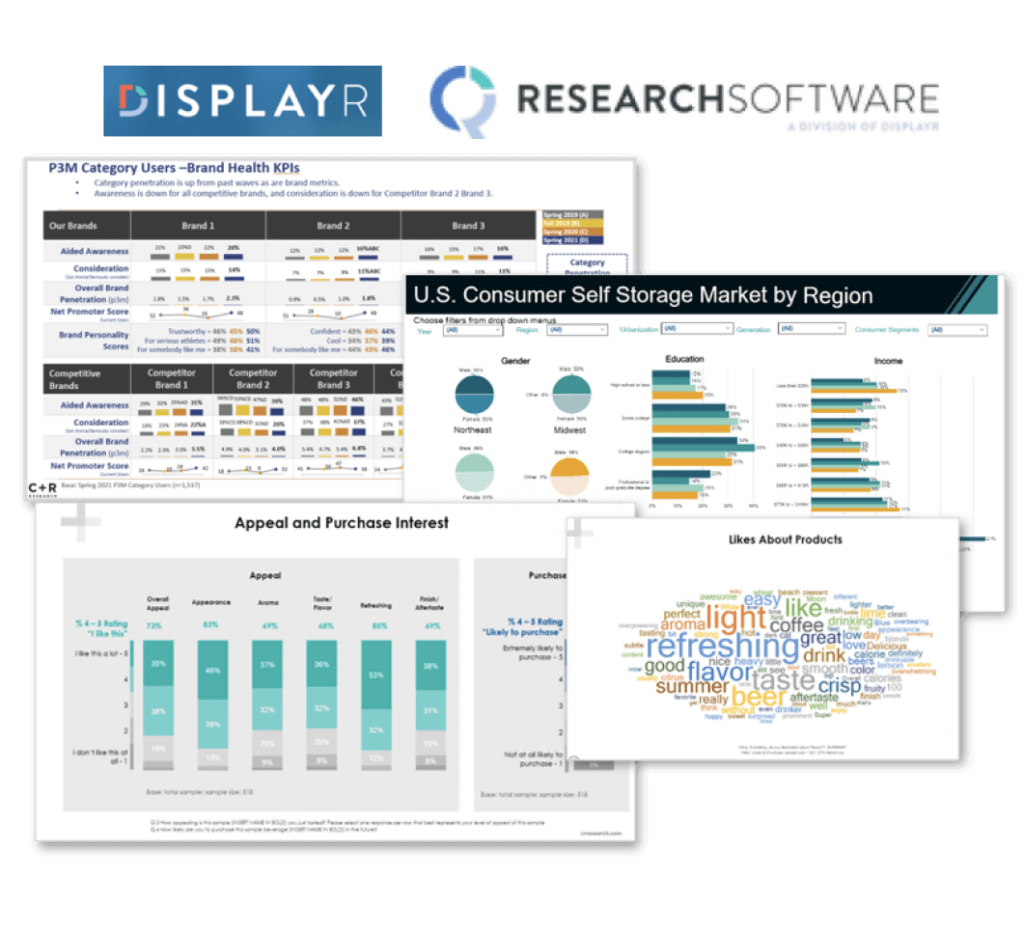
SmartHub (powered by DisplayR) to Equip You with Real-Time Access

C+R can provide real-time, direct data access to clients who appreciate & use cross-tabs and enjoy exploring data and customizing their own charts.
- Interactive, live, online dashboard
- Accessible from a web-browser/mobile device
- Accessible by multiple team members at the same time;
enables report sharing across private and shared folders - Easily filter data tables by pre-set variables
- Create your own custom table
- Huge range of easily customizable, charts,
animations and infographics. - Automatic stat testing
Our Variety of Deliverables Meets the Needs of Audiences at all Levels
Whether you are a seasoned insights professional, or just starting your career, we provide the deliverables to make your life easier, such as:
Comprehensive Reporting
We will work with you to determine the schedule for full reporting based on your objectives and the market dynamics (could be quarterly, semi-annually, or yearly).
Data Tables
+ Raw Data
For those clients who want to have a
hands-on approach to data.
SmartHub Data Access
For those clients who need access to real time results, trended views by markets or segments, etc. Ideal also for those clients who like to “roll up their sleeves” and produce their own charts and display the data to their preferences.
Proven Experience
explore brand tracking
case studies

explore brand tracking
related resources
Guides
Brand Tracking Research for Strategic Brand Growth
blog
Best Practices for Brand Health Tracking: Common Pitfalls and Solutions
blog
5 Tips to Help Your Brand Get Noticed on Social Media
